Chaos Testing SQL Server Availability Groups on Kubernetes
 Sergey Pronin
Our SQL Server operator runs Always On Availability Groups with a Kubernetes Lease deciding which replica is the primary. Deleting the primary and watching a secondary take over is the usual high-availability demo, and ours passed it.
As part of hardening Availability Group support, we wanted more than that. “A new primary exists” doesn’t tell you the two numbers an application actually cares about:
- RTO - how long writes were unavailable, as the client sees it.
- RPO - how many writes the database said it committed and then forgot.
So we measured from the client instead of kubectl get pods, and injected faults into the primary on a real cloud cluster, fixing what we found as we went. This post walks through the findings, including one regression from our own fix, and the numbers on the final build.
TL;DR
- Target: a 3-replica, synchronous-commit SQL Server 2025 Availability Group on a managed Kubernetes cluster, deployed through OpenEverest with our MSSQL provider and operator.
- Faults: pod delete, node drain, hard kill, and a real network partition of the primary. A probe wrote a row every 100ms on a fresh connection, so every outage and every lost write was measured rather than guessed.
- Findings: eight. Some are general SQL Server, Linux and Kubernetes behaviors that any AG deployment runs into, some were in our failover logic, and one was a regression from our own fix.
- Final build: 20 out of 20 fault runs passed, 0 of 32,270 acknowledged writes lost, no split brain. Planned failovers (delete, drain) paused writes for 2-10s, a hard kill for about 14s in most runs, and a network partition for 18-78s at the cut, followed by about two minutes of intermittent timeouts after it healed.
The setup
| Cluster | Managed Kubernetes v1.36. Four dedicated 8-vCPU / 16 GB nodes for SQL Server, three dedicated 4-vCPU / 8 GB nodes for everything else |
| Database | SQL Server 2025 CU9 (Developer edition), 3 replicas, synchronous commit, CLUSTER_TYPE = EXTERNAL, 2 vCPU / 6 GiB per replica |
| Primary election | Kubernetes Lease, 10s duration, renewed every 3s by a sidecar next to each SQL Server |
| Deployed with | An OpenEverest Instance with topology.type: availabilityGroup, nothing hand-tuned |
The probe
The probe is a small Go program. Every 100ms it opens a new connection to the primary Service and inserts a row with a client-side sequence number, with a 2s timeout. A fresh connection per write follows the primary Service the same way an application’s connection pool would after a failover.
From the probe’s log we score each run:
- Write outage - the longest gap between two acknowledged writes.
- Lost writes - rows the probe got an “OK” for that are missing from the primary afterwards. This must always be zero.
- Split brain - during a partition, we try to write directly to the cut-off old primary. The row must never show up.
- Recovery - time from the fault until all three replicas are synchronized again, so the AG can survive the next failure.
The faults
| Scenario | What we did | What it simulates |
|---|---|---|
| delete | kubectl delete pod <primary> | rolling update, eviction |
| drain | kubectl drain <primary's node> | node maintenance |
| kill | kubectl delete pod --force --grace-period=0 | node crash, OOM kill |
| partition | iptables DROP on everything but loopback inside the primary’s network namespace, for 120s | network split |
One lesson before we even started: a NetworkPolicy is not a partition. With Calico as the CNI, a deny-all policy only blocks new connections, and the established HADR sessions between replicas kept working. We switched to an ephemeral debug container with NET_ADMIN that drops packets with iptables inside the pod’s network namespace.
What we found
About half of the findings below aren’t specific to our operator. They are how SQL Server, the Linux kernel and Kubernetes behave together (#2, #3, #5 and #6), and anyone running AGs on Kubernetes will meet them. The rest were in our own failover logic, which is exactly what this kind of testing is for. Each fix let the tests get further, so here they are in the order we hit them.
1. A failover hook that failed silently
Our sidecar has a preStop hook that hands the primary role to a synchronized secondary before the pod dies. On the build we started from, a plain kubectl delete pod of the primary cost 66.5s of write downtime under load. The hook was supposed to make that near-instant.
It turned out the hook was erroring out before doing anything. It picks a target by querying sys.dm_hadr_availability_replica_states, and the is_local column is a SQL bit. The Go driver returns it as a bool; we scanned it into an int, so every call returned an error. The hook logged it and exited quietly, and Kubernetes did the rest the slow way. The same function guarded the upgrade path, so upgrades never moved the primary first either.
There was a second problem: the kubelet sends SIGTERM to each container as soon as its own preStop hook returns, and the mssql container had no hook. SQL Server started shutting down in the middle of the handover. Now the mssql container’s hook keeps SQL Server up until the sidecar signals that the handover is done.
2. SQL Server ignores SIGTERM
In the official mcr.microsoft.com/mssql/server image, PID 1 is launch_sqlservr.sh, a bash script. Bash as PID 1 doesn’t handle SIGTERM, and the kernel drops unhandled signals sent to a container’s PID 1. So SQL Server never heard the kubelet asking it to stop. It ran until the grace period expired and got SIGKILLed.
The evidence: with the same image and a 60s grace period, kubectl delete pod took 68s and ended in a kill, while kill -TERM on sqlservr inside the container shut it down cleanly in 5s. The fix is a preStop hook that signals the engine directly (pkill -TERM -o -x sqlservr). This affects every SQL Server container built on that image, not only ours.
3. Secondaries that stayed attached to the old primary
With CLUSTER_TYPE = EXTERNAL, a secondary that wasn’t the failover target keeps its database session on the old primary until someone re-asserts ALTER AVAILABILITY GROUP ... SET (ROLE = SECONDARY), and that only works after the old primary’s engine has stopped. Until then the new primary has no synchronized partner and, correctly, blocks commits.
The handover now waits for the old engine to stop and then re-points the remaining secondaries.
4. Split brain after a partition heals
This was the most serious finding, and the reason we measure acknowledged writes rather than errors.
We partitioned the primary, blog-ag-0. Its sidecar stopped renewing the Lease, the operator failed over to blog-ag-1, and writes resumed. So far, so good. Then we healed the partition.
| Time (UTC) | Event |
|---|---|
| 02:07:09 | blog-ag-0 (primary) partitioned |
| 02:07:55 | Graceful failover to blog-ag-1; it starts acknowledging writes |
| ~02:09 | Partition heals. blog-ag-0 still reports PRIMARY, and nothing demotes it |
| 02:09-02:16 | The operator picks “the first replica that reports PRIMARY”, which is blog-ag-0, and runs AG maintenance from its stale view |
| 02:16:11 | From that view, blog-ag-1 is a broken secondary. The operator re-seeds it, dropping the AG and the database on the real primary |
The 743 writes the probe got acknowledged between 02:08:13 and 02:16:08 were not on the primary afterwards.
The fix: the Kubernetes Lease is the source of truth for which primary is live. When more than one replica claims PRIMARY, the operator skips all maintenance, demotes only the replica that doesn’t hold the Lease, and refuses to drop an AG on anything that reports PRIMARY.
5. A 10s Lease, and 32-72s to fail over
With the primary partitioned, promoting a new primary took 32-72s, although the Lease expires after 10s. Two delays compounded:
- A Lease expiring produces no Kubernetes event. The operator only noticed on its next periodic reconcile, up to 30s later.
- The SQL driver doesn’t bound the TCP dial by the request context. Every probe of the unreachable replica, including the failover scan, waited out the driver’s 15s default dial timeout.
The fixes: a 1-second Lease-expiry watcher that enqueues the AG the moment its Lease lapses, and dial timeouts derived from the caller’s deadline. Promotion after a partition now takes 18-31s.
6. Recovery stuck for 15 minutes after a hard kill
After a hard kill, writes came back in about 15s. But in about half the runs, the AG then sat on two replicas for 974-1026 seconds. A delay that consistent usually points at a timeout somewhere.
The killed pod came back with a new IP. The primary still held an ESTABLISHED TCP connection to the old IP and kept retransmitting into the void. A deleted pod sends no RST, and Linux only gives up on such a connection after tcp_retries2, roughly 15 minutes. Until then the returning replica couldn’t rejoin.
10.2.3.22:54237 -> 10.2.0.18:5022 ESTABLISHED retransmits=11
The operator already had a fix for stale connections: restart the primary’s HADR endpoint. It just only counted replicas that were already SECONDARY, and a freshly recreated replica never is. One condition later, recovery after a kill went from up to 1026s to 67-159s.
7. The primary that couldn’t be demoted
With fix #4 in place, the operator now correctly tried to demote the stale primary after a partition healed. SET (ROLE = SECONDARY) failed with Msg 41104 on every retry, and restarting endpoints didn’t help. The AG ran with two primaries for 40 minutes.
No data was lost. The stale primary had no synchronized secondary, so synchronous commit wouldn’t let it acknowledge anything. But the primary Service routed about half of new connections to it, and they hung.
The fix: if the demote keeps failing with 41104, restart SQL Server on the stale replica. It comes back, sees the real primary, and rejoins as a secondary.
8. A regression from our own fix
The first version of fix #7 went in, and the very next rolling update of the operator left the AG without a primary.
During a planned handover, the old primary keeps renewing the Lease for a few seconds after the new one is promoted. Our new guard saw two primaries, trusted the Lease, decided the brand-new primary was the stale one, and restarted it while the old one was already shutting down. No primary at all.
The fix is about time, not logic:
- A replica is treated as stale only after 30s without the Lease. A planned handover moves the Lease in about 10s.
- It is restarted only after 2 minutes, and at most every 2 minutes.
- It is never restarted if it has a synchronized secondary. A primary with a synchronized secondary is acknowledging writes, and you don’t kill that.
The lesson: every automated repair is also a new code path that can go wrong. A test plan needs the boring paths, like your own upgrade, not just the scary ones.
How we tested, and how we changed the testing midway
Our first approach was “run all 20 scenarios overnight and read the results in the morning”. It produced a lot of numbers, and it buried the first real failure under 15 more runs on a cluster that was already in a bad state.
So we changed the loop:
- Run each scenario once. Stop at the first failure.
- Assess, fix, redeploy. The redeploy is itself a rolling update, so it is a test too. That’s how we caught #8.
- Only when all four scenarios pass once, run four more of each.
A run fails if any acknowledged write is lost, the split-brain write succeeds, or the AG isn’t back to three synchronized replicas within 10 minutes. Across all builds we injected more than 80 faults; the results below are the 20 runs on the final build.
Two of those runs had to be repeated because the harness failed rather than the database: the probe pod disappeared in one partition run, and the Kubernetes API server timed out during a drain. Both were re-run, and both re-runs passed. In one drain run the harness couldn’t read the Lease, so we scored it against the AG primary directly.
Results
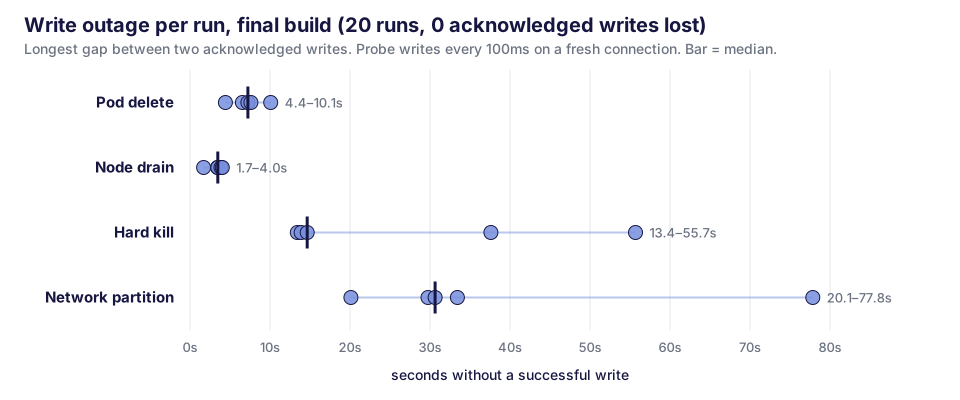
| Scenario | Runs | Write outage (min / median / max) | New primary after (max) | Back to 3 synced replicas (max) | Acked writes lost | Split-brain writes |
|---|---|---|---|---|---|---|
| delete | 5 | 4.4s / 7.2s / 10.1s | 4.1s | 84.5s | 0 | - |
| drain | 5 | 1.7s / 3.5s / 4.0s | 10.3s | 290.4s | 0 | - |
| kill | 5 | 13.4s / 14.7s / 55.7s | 19.7s | 158.9s | 0 | - |
| partition | 5 | 20.1s / 30.6s / 77.8s | 30.9s | 339.3s | 0 | 0 |
All times are measured from the moment the fault was injected. “New primary after” is when the harness saw the role label move to another pod, which can lag the actual role change by a few seconds, so for drains it is longer than the write outage itself.
What the numbers mean in practice:
- Planned operations (delete, drain) paused writes for 1.7-10.1s.
- A hard kill costs 13-15s in most runs: 10s for the Lease to expire plus promotion. In two of five runs (37.6s and 55.7s) the surviving secondary was slow to reconnect to the new primary, and the operator kept retrying the rejoin until it did. That one is still on our list.
- A partition paused writes for 18-78s at the cut. The write we sent directly to the cut-off old primary timed out every time and never landed: with no synchronized secondary, synchronous commit wouldn’t let it harden. After the 120s partition healed, the operator restarted SQL Server on the old primary, it rejoined as a secondary, and all three replicas were synchronized again 5.3-5.7 minutes after the cut.
- Data: zero acknowledged writes lost across all 20 runs.
Write by write
The longest gap is a single number per run. The chart below has every write attempt from all 20 runs, so you can see what the client saw before, during and after it.
Two things show up here that the longest gap doesn’t capture:
- After a partition heals, writes stay degraded for a little over two minutes. The old primary still reports PRIMARY, so the primary Service sends about half of new connections to it, and those writes hang until the client gives up after about 5s. The rest succeed, so writes never stop completely, but the gaps between acknowledged writes reach 15-30s. It ends when the operator restarts SQL Server on the stale replica. That delay is the 2-minute wait from fix #8, which keeps the operator from restarting a primary in the middle of a planned handover. In partition run 3 this window, not the cut, produced the longest gap of the run (20.1s); the cut itself paused writes for 18.3s. Shortening it without bringing back bug #8 is on our list.
- After a hard kill, three of five runs had a second pause of 8-10s about 100s after the fault, while the replacement replica was rejoining the AG.
What the application sees
When a write fails during a failover, the error tells you how to react.
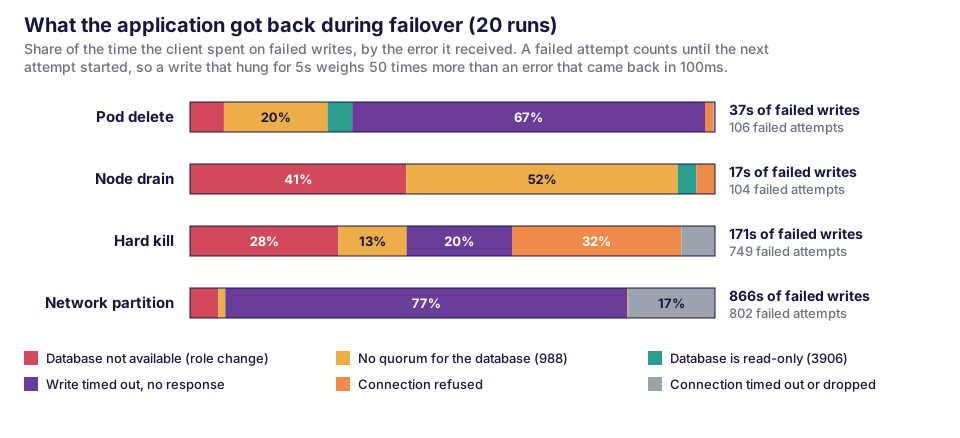
Most failed writes came back within 100ms with a SQL Server error. The database was changing roles (“not in the PRIMARY or SECONDARY role”), or the AG didn’t have a quorum for it yet (Msg 988). A few writes reached a replica that had just become a secondary and got Msg 3906, read-only database. All of these are safe to retry right away on a new connection.
The expensive failures are the writes that get no answer. During a partition, about three quarters of the failed-write time went to writes that hung until the client timeout: our 2s deadline, plus about 3s for the driver to cancel the query. And a timeout says nothing about the outcome: 15 of the 148 writes that timed out had committed. Our probe uses its sequence number as the primary key, so a retry can’t create a duplicate. Application writes need the same property, or a way to check before retrying.
What we’d tell anyone running SQL Server AGs on Kubernetes
- Measure from the client. Pod status doesn’t show what the application experiences.
- Count acknowledged writes. “No errors” is not the same as “no data loss”.
- Synchronous commit with a required synchronized secondary is your seatbelt. In every incident after the split-brain fix, including the ones we caused, it’s why no acknowledged write was lost.
- A NetworkPolicy is not a partition. Test with something that actually drops packets.
- Deleted pods don’t say goodbye. Expect half-open TCP connections to dead IPs.
- Check what PID 1 does with SIGTERM. In the stock SQL Server image, nothing.
- Your remediation logic is production code. Re-test the planned paths after every fix.
- A timeout is not a failure. Some of the writes that timed out had committed. Make writes idempotent so a retry is safe.
Try it
All eight fixes are in MSSQL operator v0.1.14, and in MSSQL provider v0.1.14 for OpenEverest, which bundles it. The release notes list the changes, and the Availability Groups guide describes how the operator handles failover, recovery and a stale primary after a partition.
If you run SQL Server on Kubernetes, or plan to, book a call with our team. We can walk through your setup, or run the same tests against it.
 Solanica Team